Events
The Events page shows every handler call in your driver in real time. See exactly what Control4 is sending, what arguments are passed, how long each handler takes, and whether it succeeded or threw an error.
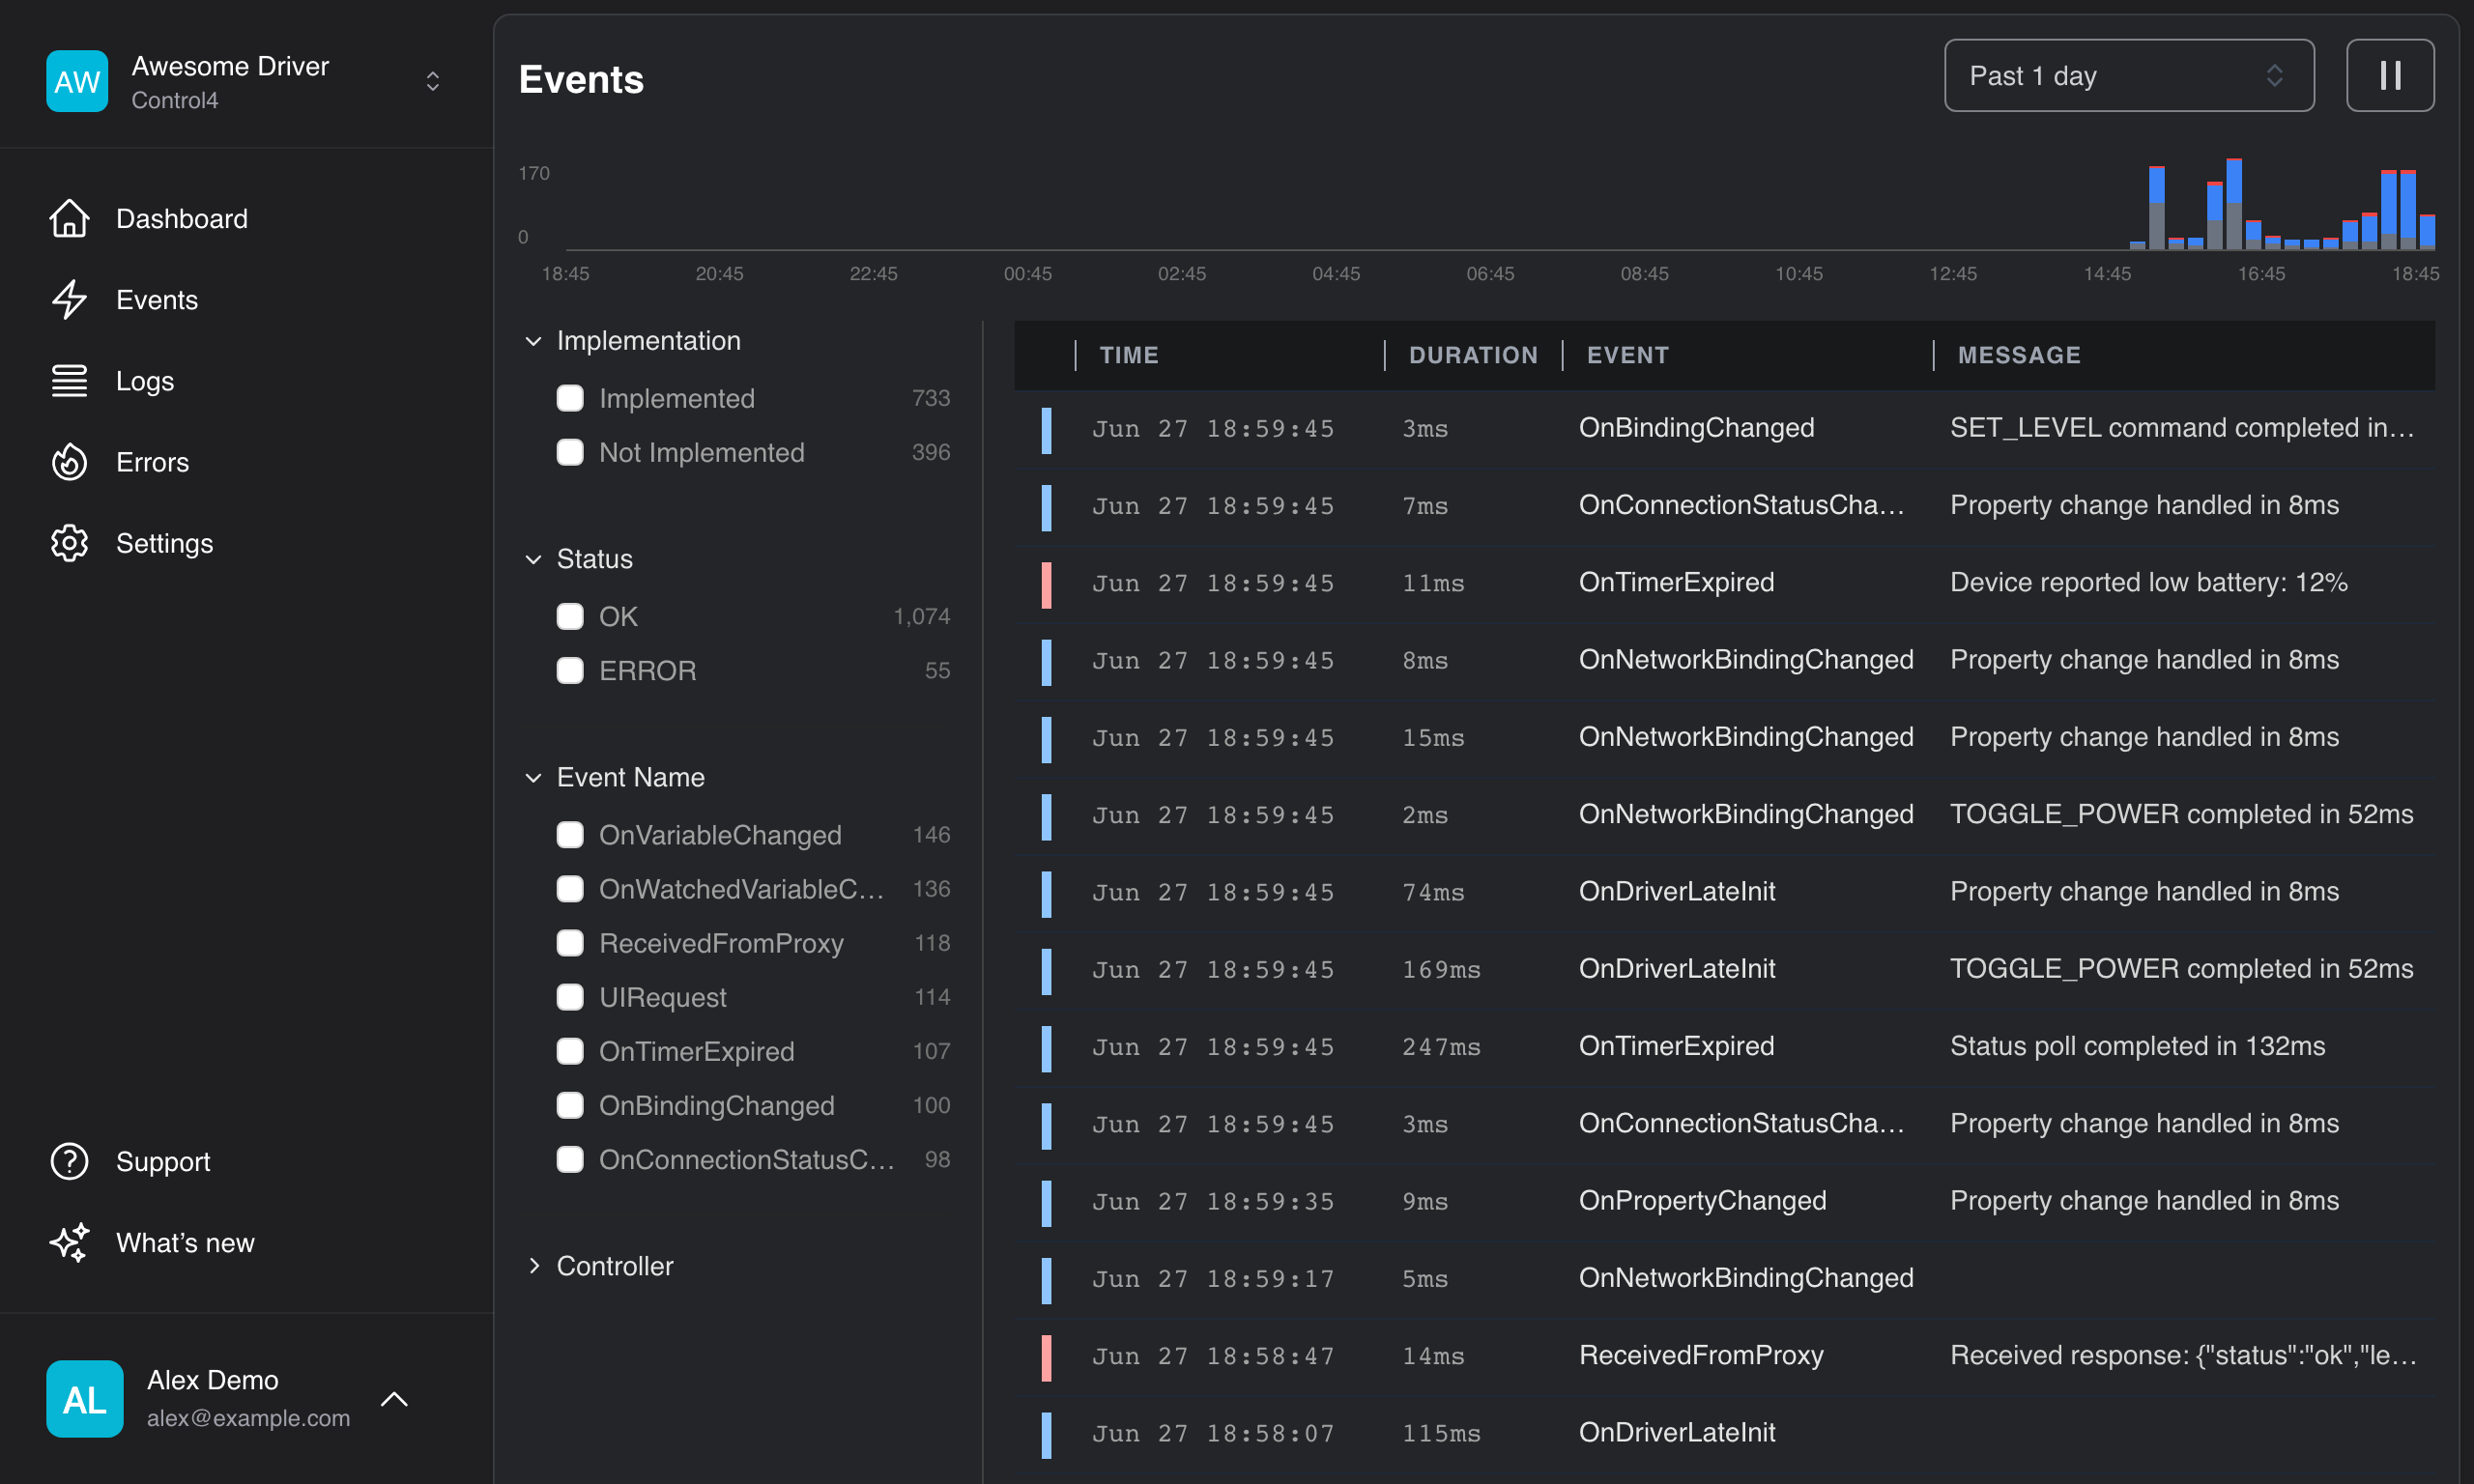
Real-Time Event Stream
Events stream in as they happen. Each row shows:
- Status — a coloured indicator showing whether the event succeeded (green), errored (red), warned (amber), or other status
- Time — when the event occurred (hover for the full timestamp)
- Duration — how long your handler took to execute
- Event — the handler name (e.g.
OnPropertyChanged,ExecuteCommand) - Message — the error message or last log output, if any
New events appear at the top of the list with a brief pulse animation so you can see what just arrived.
Pause and Resume
Click the pause button next to the time filter to freeze the stream while you inspect something. While paused:
- Events continue to buffer in the background
- A badge shows how many events are waiting (red if any contain errors)
- Click play to flush the buffer and resume live streaming
Jump to Live
If you scroll down through older events, a Jump to live button appears to snap you back to the latest events.
Event Detail
Click any event row to open the detail drawer.
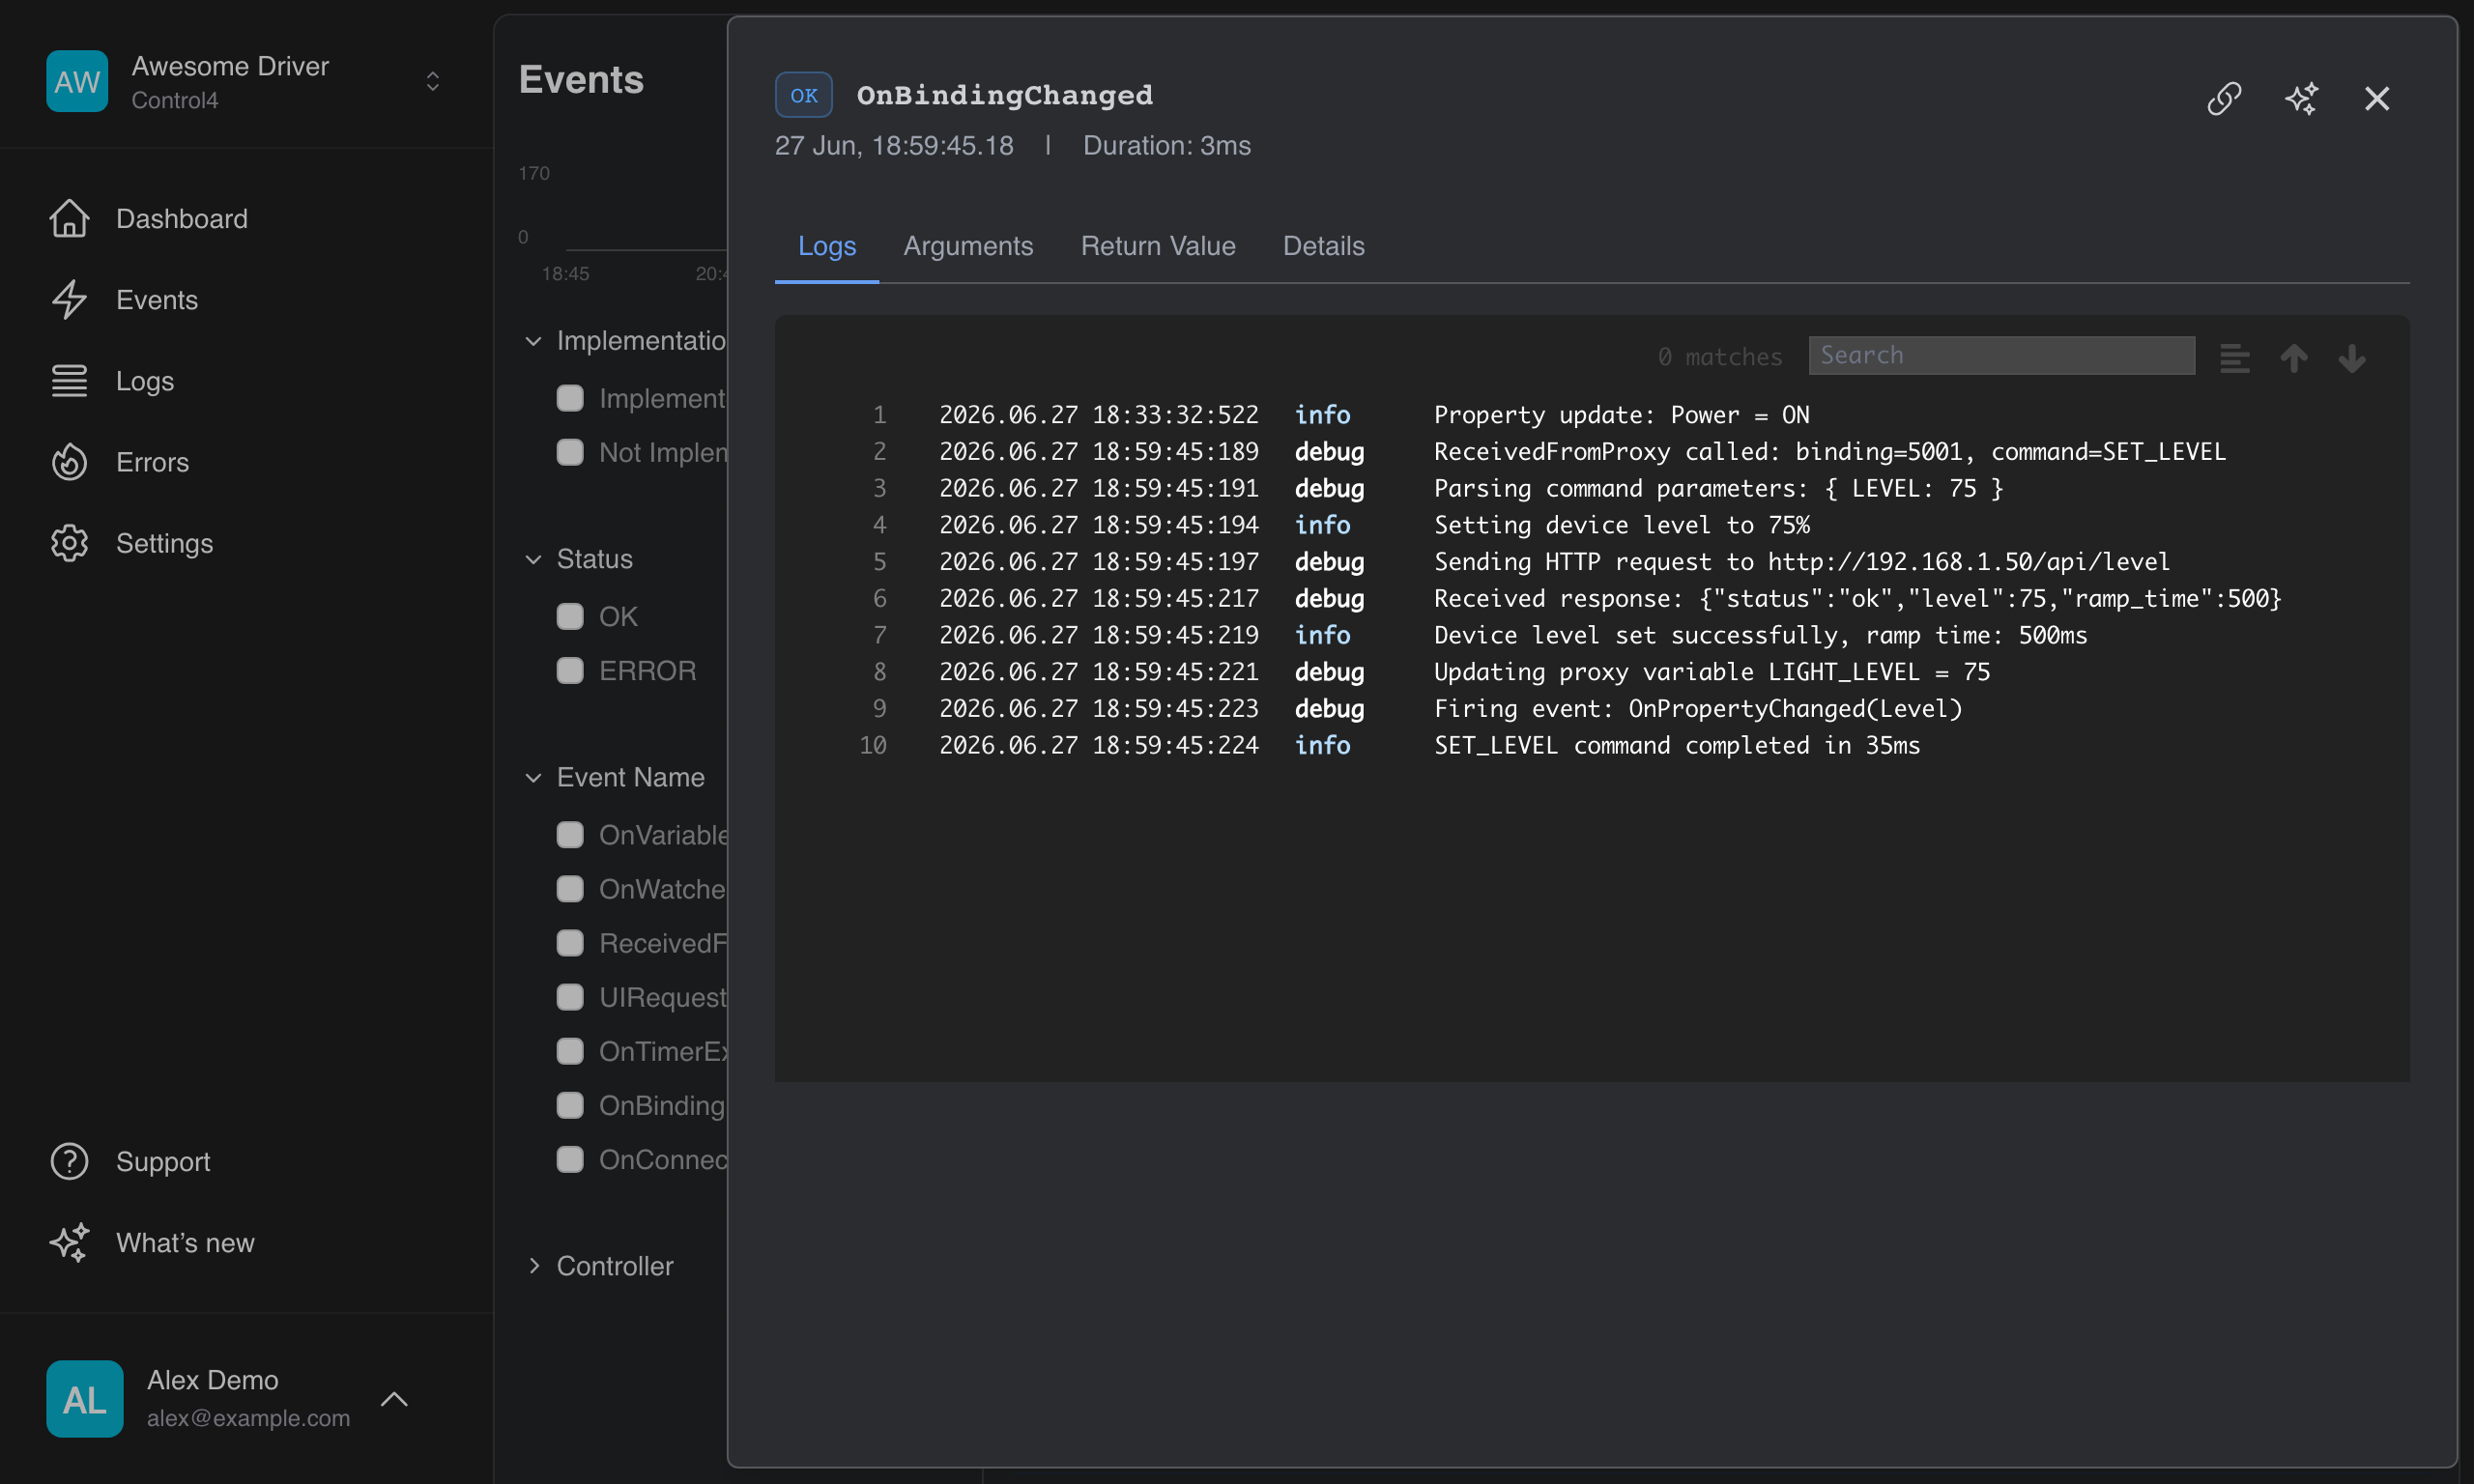
The drawer has tabs:
- Overview — duration, result, arguments (as an interactive JSON viewer), and error context if present
- Logs — all log messages captured during this event's execution
- Arguments — full JSON view of the arguments passed by Control4
- Error — if the event threw, shows the error type, value, and full stack trace
Events are shareable — the drawer URL is unique and can be copied and sent to others.
Histogram
Above the event list, a stacked bar chart shows event volume over time. Bars are coloured by status so you can quickly spot error spikes. Hover over any bar for a breakdown by status with counts.
The histogram automatically adjusts its bucket size based on the selected time range.
Filtering
Time Range
Select a time range from the dropdown: 15 minutes, 1 hour, 4 hours, 1 day, 2 days, 7 days, 14 days, 30 days, 60 days, or 90 days. Available ranges are clamped to your plan's data retention period.
Facets
Filter by multiple dimensions simultaneously:
- Status — Success, OK, Error, Fatal, Warning, Info, Debug, Trace
- Event Name — multi-select dropdown showing all captured handlers with counts
- Controller — filter by specific controller (shown as formatted MAC address)
Each facet shows the count of matching events, so you can see the distribution at a glance.
Implementation Status
Toggle between showing all events, only implemented handlers, or only unimplemented handlers. Unimplemented events are shown at reduced opacity so they're visually distinct. See Captured Handlers for what Anvil captures and how implementation coverage works.
Facet filtering (Status, Event Name, Controller) is available on paid plans. Implementation status filtering and basic event streaming are available on all plans.
Keyboard Navigation
Navigate the event list without leaving your keyboard:
j/k— move down / up through eventsEnter— open the selected event's detail drawer