Overview
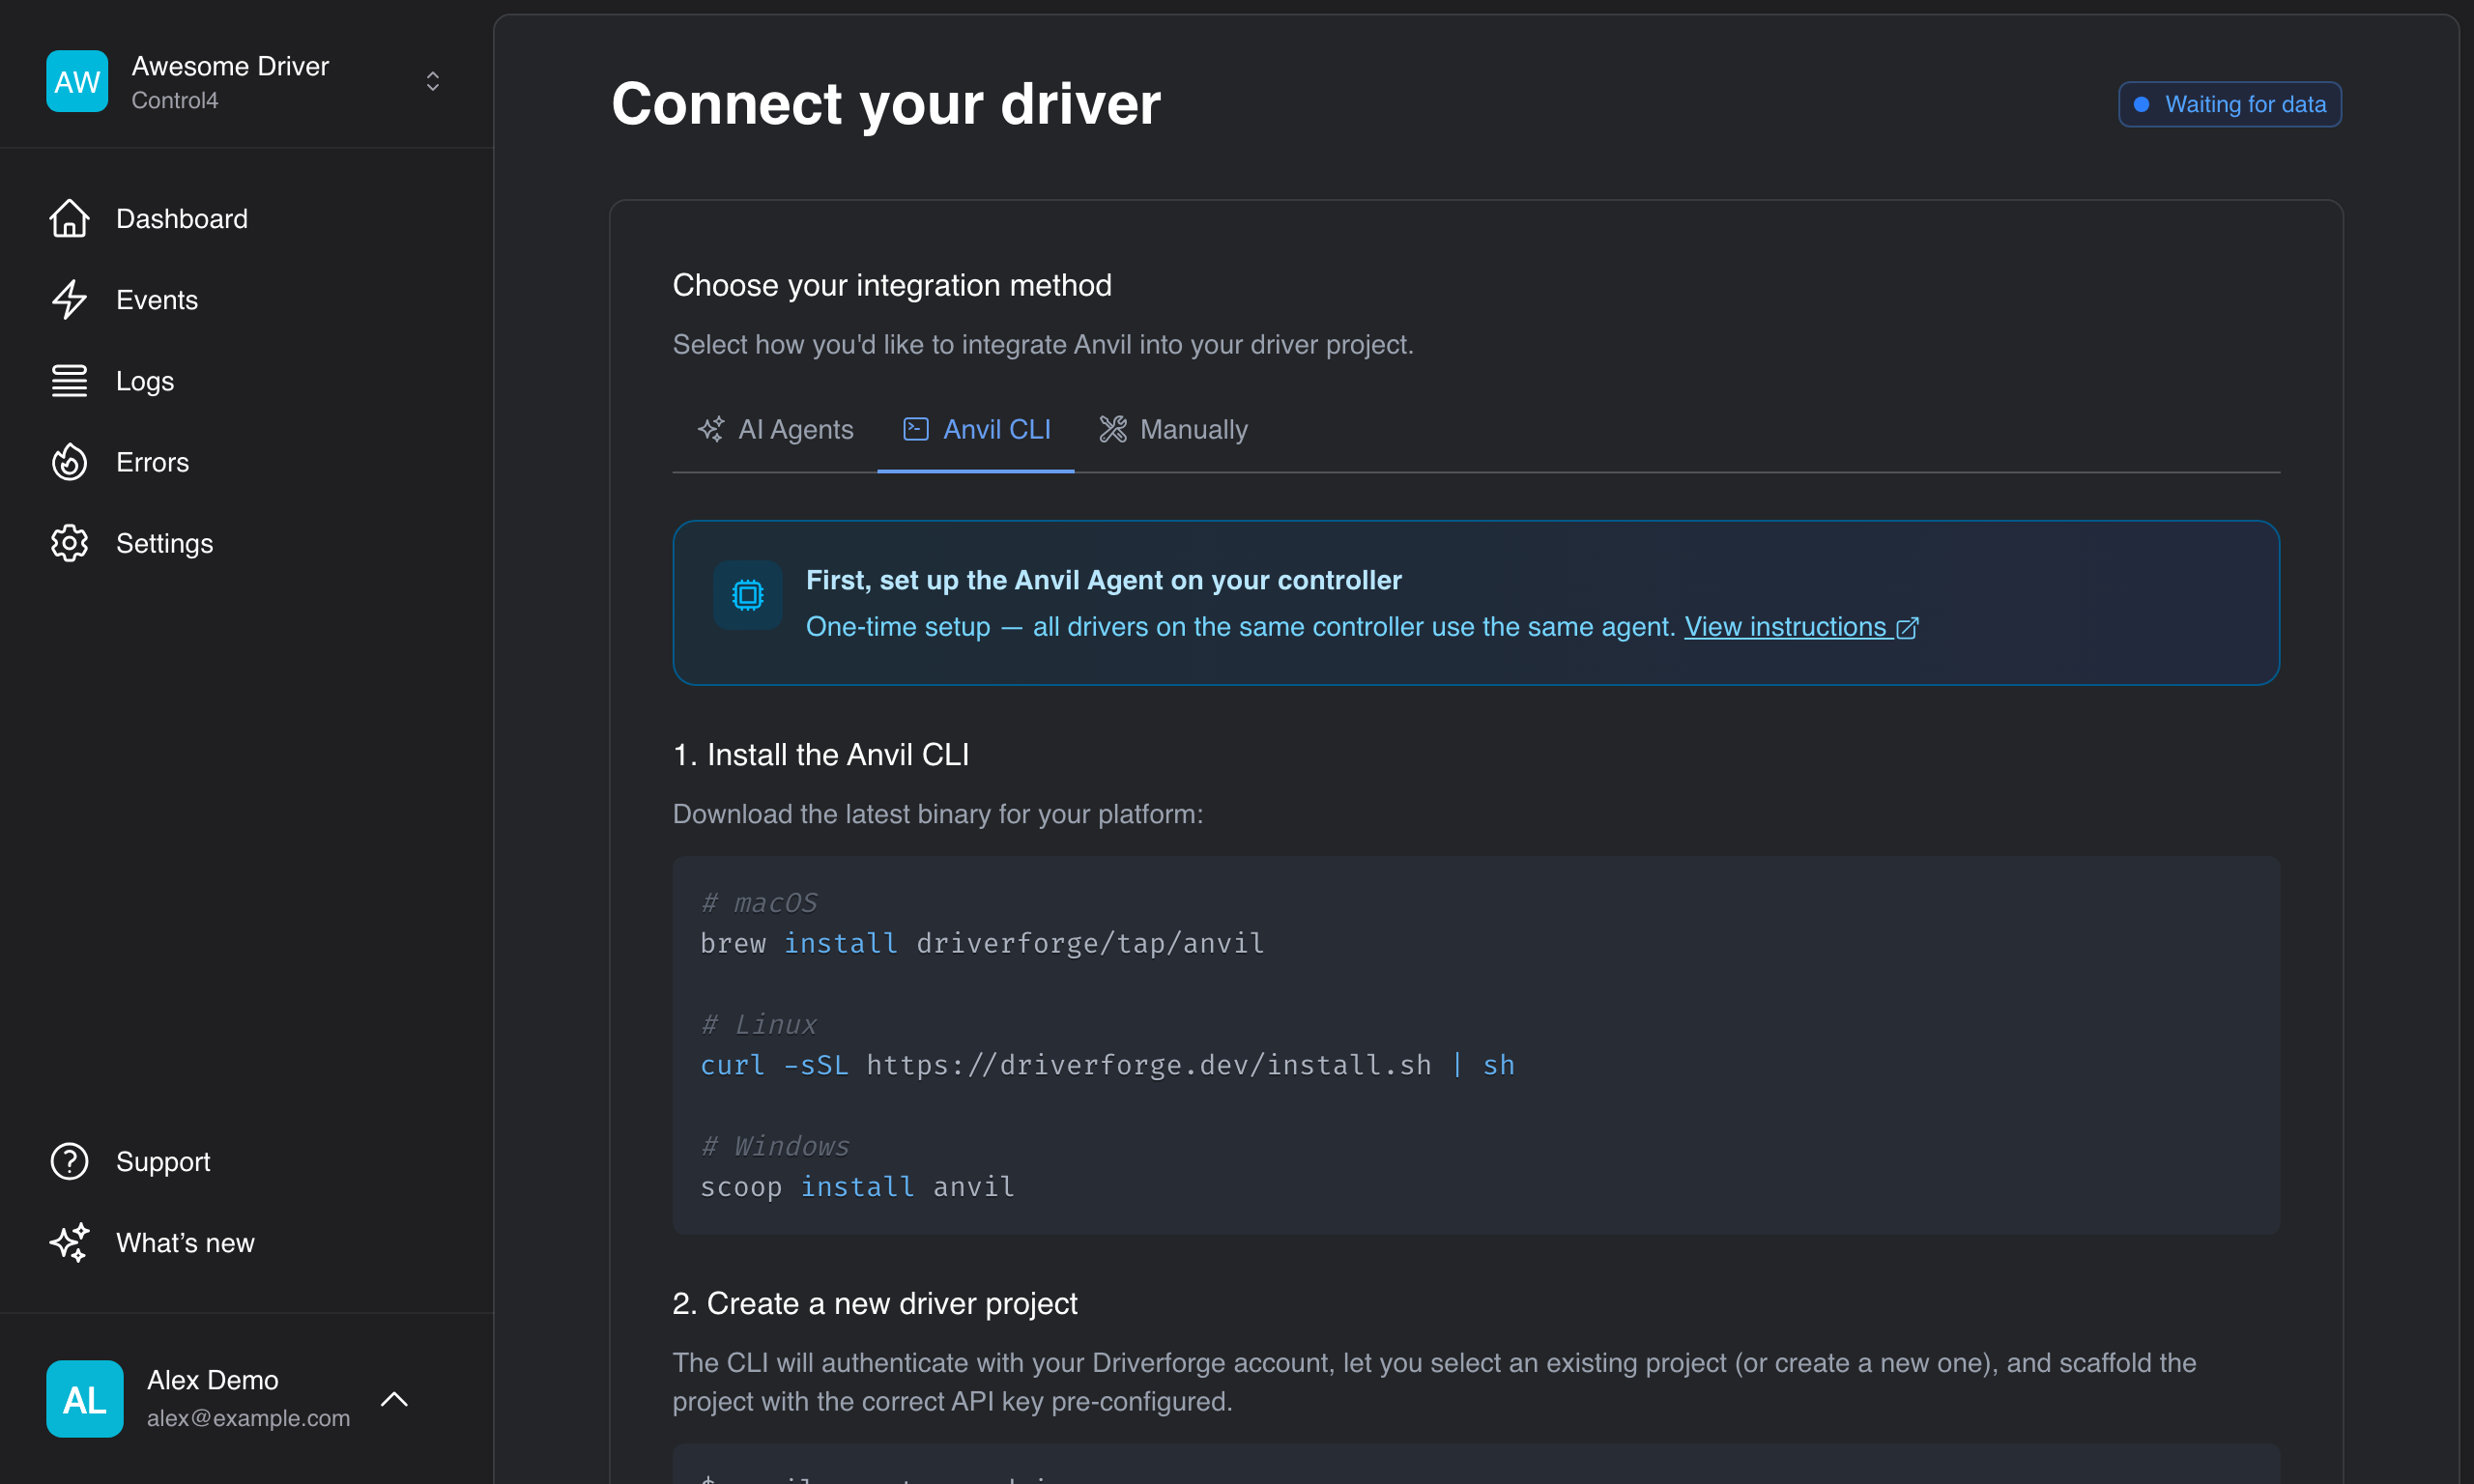
The Anvil platform gives you a real-time view of what's happening inside your Control4 drivers. Events, logs, and errors stream in as they happen — no more guessing what your driver is doing, or digging through Composer's Lua output.
What You Get
Events
Every handler call your driver receives is captured automatically — OnPropertyChanged, ExecuteCommand, ReceivedFromProxy, and 100+ others. For each event you can see the exact arguments Control4 passed, how long your handler took to execute, and whether it succeeded or threw.
Logs
Forward your driver's log output to Anvil and see it in real time, persisted across driver reloads and Composer refreshes. Filter by level, search by message, and jump from a log entry to the event that produced it.
Errors
When your driver throws, Anvil captures the error with a full stack trace and groups identical errors together. See at a glance which errors are new, which are recurring, and how often each one occurs.
Organization Dashboard
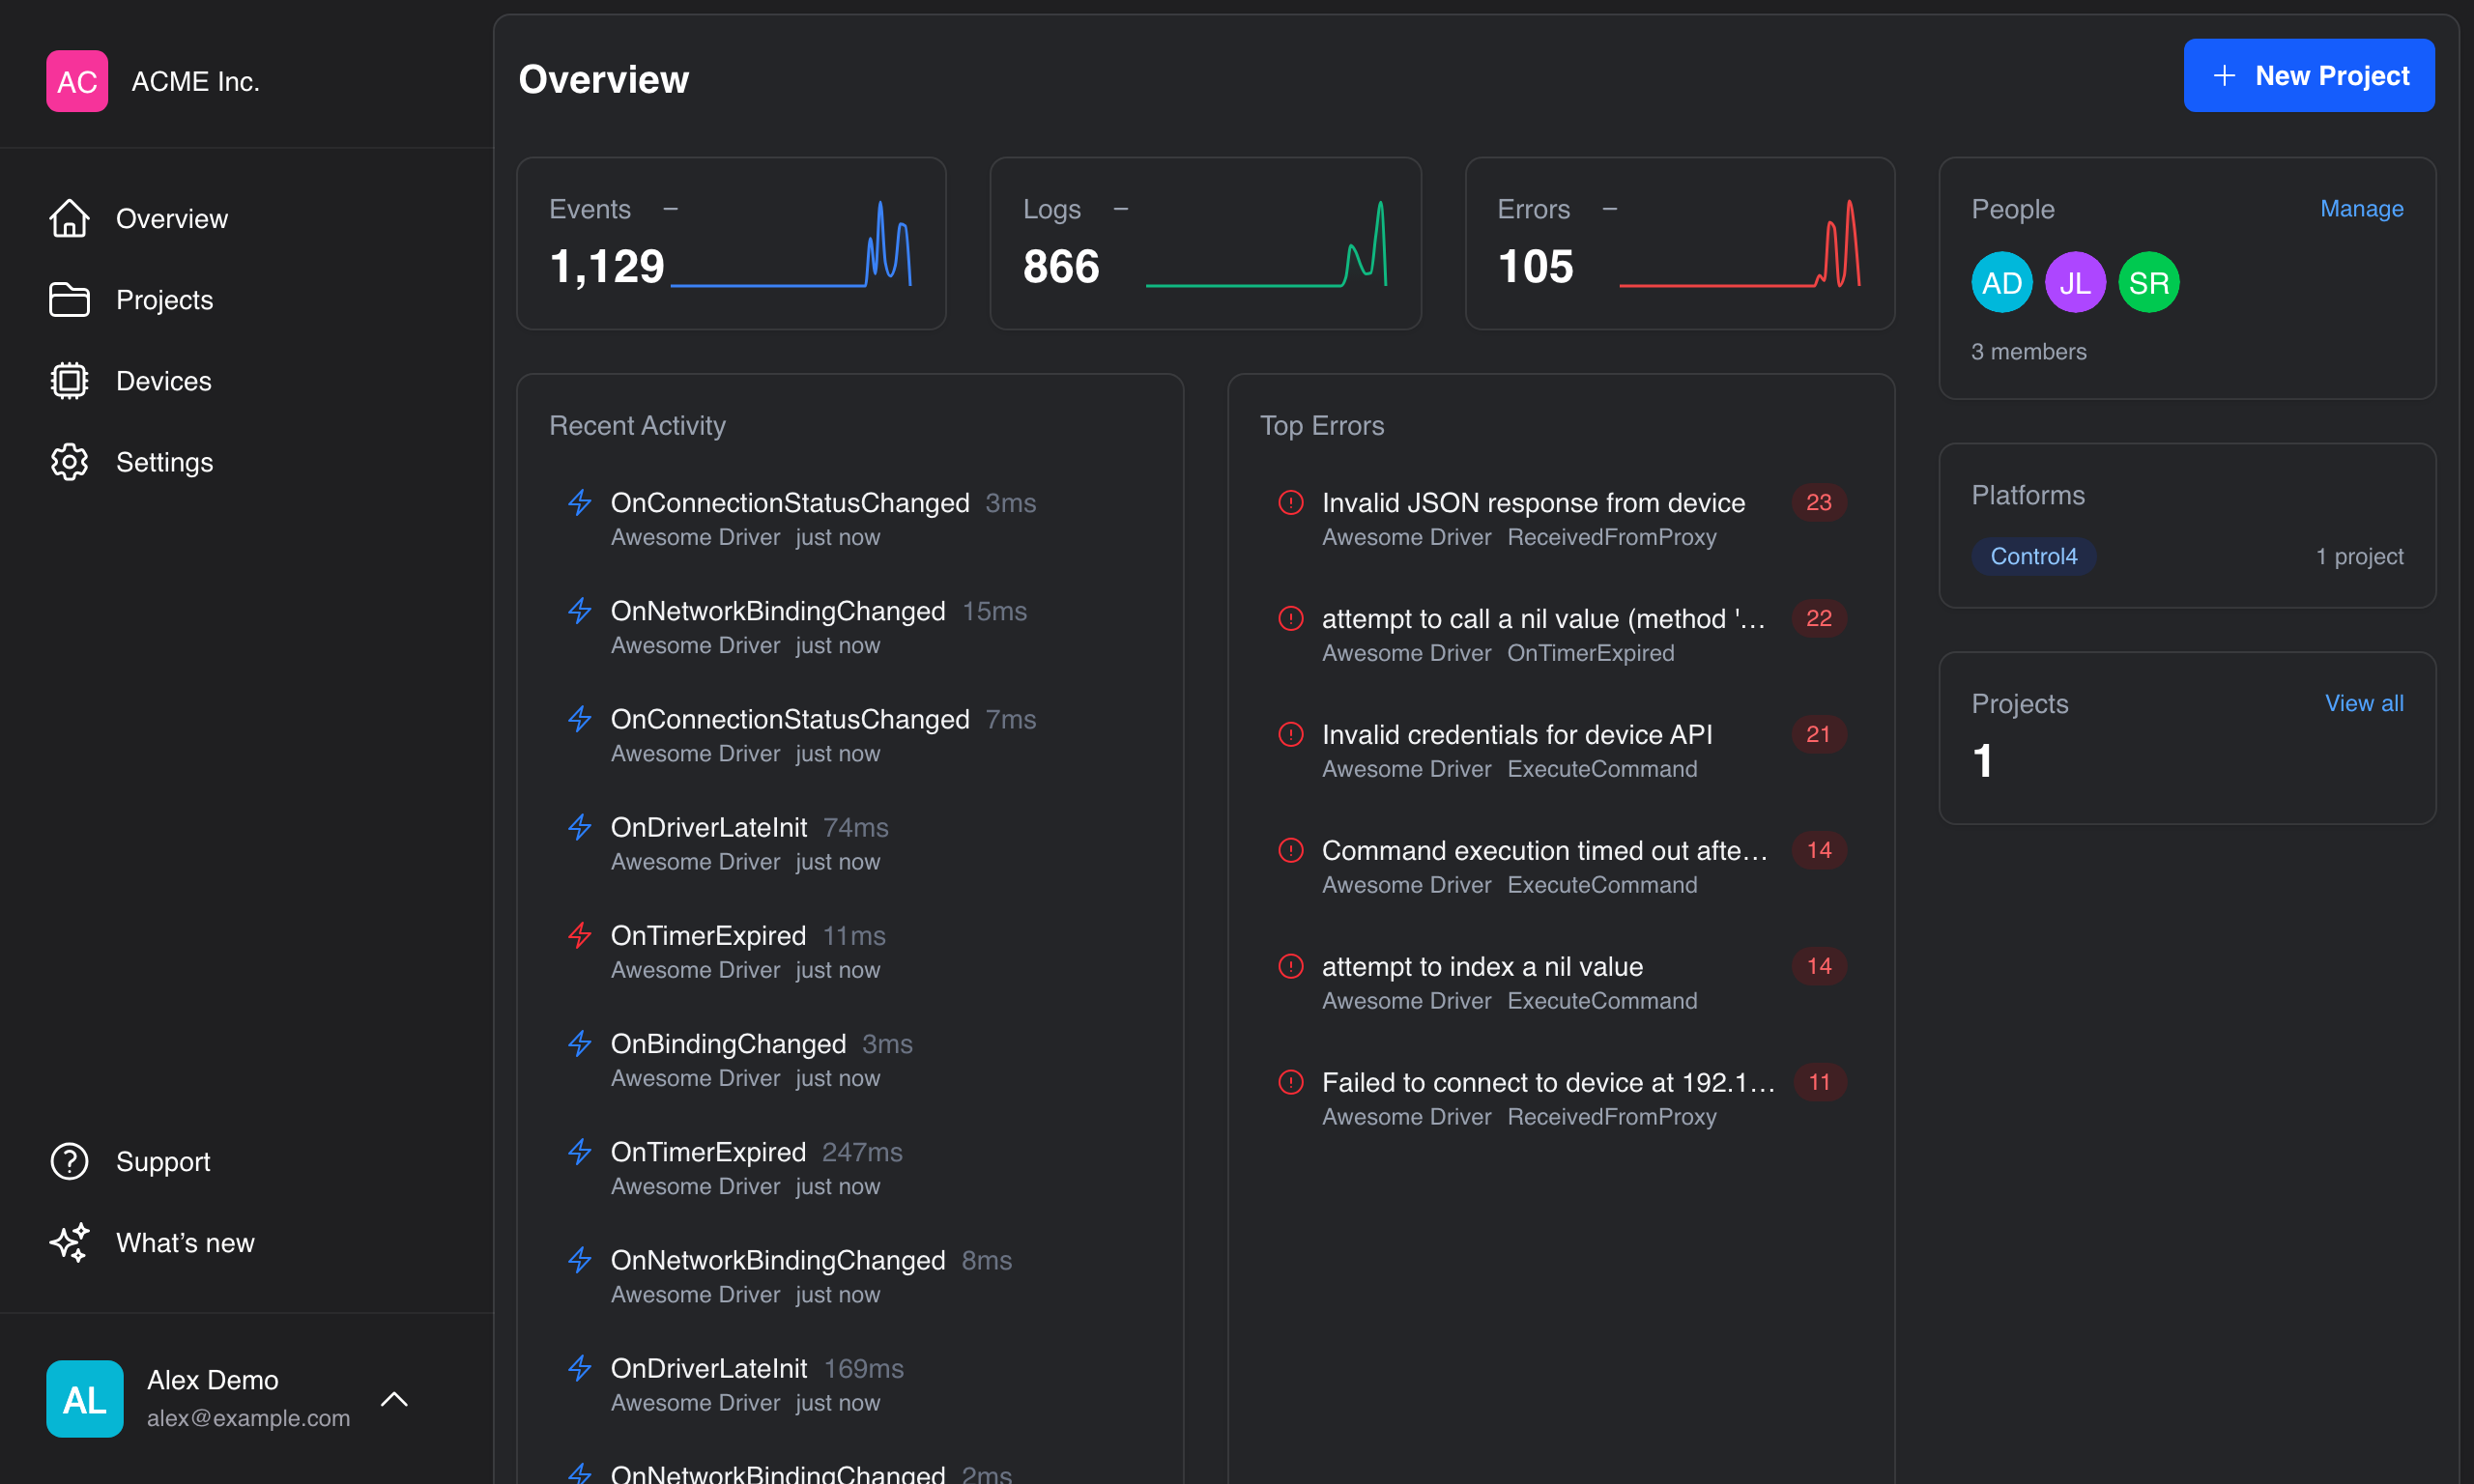
If you're working across multiple projects, the organization dashboard gives you a bird's-eye view of activity across all your drivers — aggregate stats, a combined timeline chart, recent activity, and top errors.
Real-Time Streaming
All three views — events, logs, and errors — stream in via WebSocket. You can pause the stream to inspect something, and a badge shows how many items are buffering while paused. Click play to flush the buffer and resume.
Managing your workspace
Beyond the data pages, the platform is where you manage everything around your drivers:
- Organizations — your top-level workspace, with members & roles
- Projects — one per driver, each with its own API keys
- Devices — the controllers you deploy to
- Subscription & billing — your plan, usage, and payment